


Mapping the mind’s eye
ASU engineering research advances the neuroscience of vision
-v2")
Above: When our eyes register a given scene, such as the example shown in the disk on the left, the neurons in our brains display it in a very different way, as shown by the artistically rendered “retinotopic map” shown at the center. Yalin Wang, an associate professor at Arizona State University, has published a groundbreaking new research paper on retinotopic mapping in the V1 area of the brain, shown on the right. Wang also has been awarded a National Eye Institute grant to launch a four-year project focused on building a retinotopic “atlas” that can improve scientific understanding of healthy visual function as well as the nature of vision disorders. Illustration adaptation by Rhonda Hitchcock-Mast/ASU
Specific areas of the human brain process different functions, such as the auditory cortex for hearing and the olfactory cortex for smell. Among these functional areas, the single largest is devoted to vision. The dominance of the visual cortex may not be surprising given the importance of sight to the human species. But science still has a lot to learn about the way input from our eyes is represented by our brains.
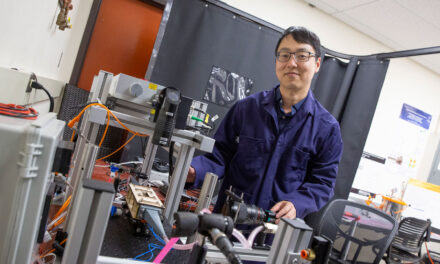
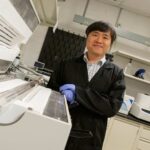
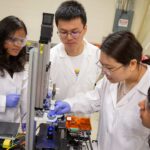
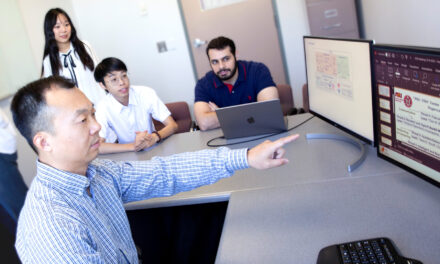
This specialized work within neuroscience is called retinotopy or retinotopic mapping, and a leading researcher in the field is Yalin Wang, an associate professor of computer science and engineering in the Ira A. Fulton Schools of Engineering at Arizona State University.
“Retinotopic maps depict the way neurons in the brain display our visual field, which is what we see or the way light stimulates our retinas,” Wang says. “Our current research examines a specific area in the brain called V1, which is one of 14 areas devoted to visual processing. So, it’s a very defined space, but our understanding has remained limited.”

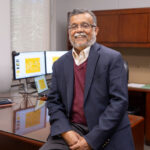
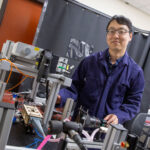
Yalin Wang
Wang says this type of research applies an advanced form of magnetic resonance imaging, or MRI, technology. While structural MRI devices are widely employed in clinical practice, they reveal only static conditions. However, neuroscience needs to extract data from dynamic processes. For example, human metabolism changes from morning to afternoon and again during the evening, and this flux means brain imaging signals and associated “noise” or interference levels change, too.
The capacity to operate in such fluctuating conditions makes newer high-field functional magnetic resonance imaging, or fMRI, particularly valuable. This technology can generate live or “in vivo” retinotopic maps, and this means retinotopy can now significantly contribute to understanding human sight.
Even so, Wang says quantifying these maps or describing them mathematically remains particularly difficult. The low spatial resolution and low signal-to-noise ratios of current fMRI scans mean existing quantification methods do not preserve the surface topology or structure of the visual cortex and often introduce large geometric distortions.
“The challenge comes in understanding how our brains convey what we see — our two-dimensional visual field — onto the cortical surface of our brain, which is a curved, three-dimensional surface,” says Wang, who is a faculty member in the School of Computing and Augmented Intelligence, one of the seven Fulton Schools.
It’s similar, though in reverse, to the difficulty of displaying our three-dimensional Earth in two-dimensional maps. So, Wang and his team have applied differential geometry to address this challenge in a groundbreaking new paper published by the journal Medical Image Analysis. Their innovative work also has secured support from the National Eye Institute for a new $1.5 million, four-year research project.
In the published study, Wang and his team explain a framework they have developed to successfully quantify retinotopic maps in V1. They did so through the application of computational conformal geometry and quasiconformal Teichmüller theory. Conformal geometry maintains the angles of lines representing a surface, but not necessarily the distances. Quasiconformal Teichmüller theory then works to encode more complex structures by generalizing from discrete conformal maps.
In combining these approaches, the research team created a process that smooths out fMRI data signals, corrects for errors in their topologic structure and quantifies the mapping through a Beltrami coefficient, which is a differential geometry concept that measures angle distortions in quasiconformal maps. The results rigorously and completely characterize retinotopic maps.
“We succeeded in applying this new framework to analyze a large set of retinotopic maps in V1 from the Human Connectome Project, which is the most significant retinotopy dataset available,” Wang says. “We found that this method generates an accurate quantitative description that is fully reconstructable. Consequently, this approach can be applied to improve our understanding of visual cortical organization not only in V1, but in other visual areas, too.”
Moving forward from the results of the journal paper, the new National Eye Institute-funded project seeks to build a retinotopic “atlas” through hierarchical Bayesian analysis, which is a form of statistical modeling used to develop computational strategies.
Such complex work will involve close collaboration with Zhong-Lin Lu, who researches the psychological connection between perception and cognition at New York University. Other collaborators include researchers from the University of Southern California, the Albert Einstein College of Medicine in New York and the University of Montreal in Canada. This broad array of support will provide clinical data for analysis that will improve the accuracy and impact of the project’s developments.
“Building this kind of atlas will be a major effort. But the result can permit more meaningful understanding of healthy visual function as well as the nature of related disorders,” Wang says. “We also want to understand what is happening not only in a general sense, but more specifically what is happening with different types of patients and different types of brains.”
Eventually, Wang says, the team hopes to equip clinicians with tools to assess a given patient over time and inform them that, for example, they have a 30% chance of developing glaucoma within the coming five years. This knowledge can enable early intervention and help yield the best possible health outcomes.
A portion of the research reported in this publication is supported by the National Eye Institute of the National Institutes of Health under Award Number R01EY032125. The content is solely the responsibility of the authors and does not necessarily represent the official views of the National Institutes of Health.
